An attempt at visualizing the Go GC
A rejected talk proposal for GopherCon India '23.
In late 2022, I stumbled upon this visualization during my exploration around the Go GC (for learning the internals). A thought came to my mind, “Wouldn’t it be pretty cool if someone could build a tool to visualize the live process of mark and sweep?”, and I got more curious than ever.
This was more tempting than anything else I had ever worked on. Why? Because I always wanted to explore Go internals and what better way to explore than to hack around stuff and find out more?
I talked to a few people, explained about the experiment, and most of them wanted me to publish this post, irrespective of how much progress I made on the experiment, so, here I am.
(My original 2022 playground got nuked due to a boot failure after a Windows Update, and I eventually had to reset the entire system. (thank you Windows!) 1)
What was I trying to build?
As explained above, Pusher’s GC visualizer was the starting point of this experiment. Their visualizer was meant for educational purposes. “What would it take to build a visualizer with real data?” was the real question.
Okay, wait. But even before all of this, is it even required? Probably not. I don’t know if a standalone visualizer would help in actual production use cases. But in true hacker spirit, I had to do it.
The end goal for this exploration is to build a tool that:
- attempts to extract maximum information from the Go runtime and treats it as the source of truth
- Use the extracted information to build relationships between individual runtime “objects”
- Find a way to determine object liveness from the extracted info, or different sources
- Construct an object graph with object liveness info to color “objects” to emulate the tri-color mark-sweep algorithm
- Iterate over different object graphs and generate an animated overview of the GC process using real data
Simply put, I wanted to build a tool which would show a “live” object graph with objects colored as black/grey/white, with the colors changing with respect to time.
To understand things further, I had to learn some GC theory. Let me give you a walkthrough about a few things in GC theory.
Understanding some GC theory
Okay, first things first. What is the heap?
In simple terms, a heap is either a continuous array of memory words or a non-contiguous collection of memory blocks, where each word is a sequence of bytes large enough to hold a pointer. Allocating objects on the heap is usually meant for objects whose size, quantity, or lifetime cannot be determined at compile-time. Think of it as a “free store” that can be managed manually or automatically. The heap is usually represented as an object graph, where the nodes are heap objects and the edges are references to the heap objects.
In manual memory management, if we incorrectly use explicit deallocation to reclaim memory, we may accidentally free memory that has references to it. These references are often called as dangling pointers. Following dangling pointers may result in unpredictable behavior.
This is where GC (garbage collection) comes into play and helps in preventing the creation of dangling pointers. The garbage collector attempts to reclaim memory that was allocated by the program, but is no longer referenced. The GC has the context of the global heap state, which helps in making reclamation decisions easier.
Remember, GC is not a silver bullet, and manual memory management can be performed correctly with care. I do not want to start a war :)
Next are mutators and collectors, the two most commonly discussed “actors” in the context of garbage collection.
The mutator allocates new objects and “mutates” the (heap) object graph by changing references. A collector discovers unreachable objects (objects that cannot be reached by following any set of edges from the roots).
Bear with me, some more theory incoming:
An object is said to be live if it will be accessed sometime in the near future by the mutator. However, figuring out object liveness is a hard problem: liveness is non-deterministic; there is technically no possible way to determine if an object will be accessed by the mutator before time X.
A way to figure out if an object is live is to approximate it. Approximation can be done by object reachability. (check if an object X is reachable from an object Y by following references from Y -> X)
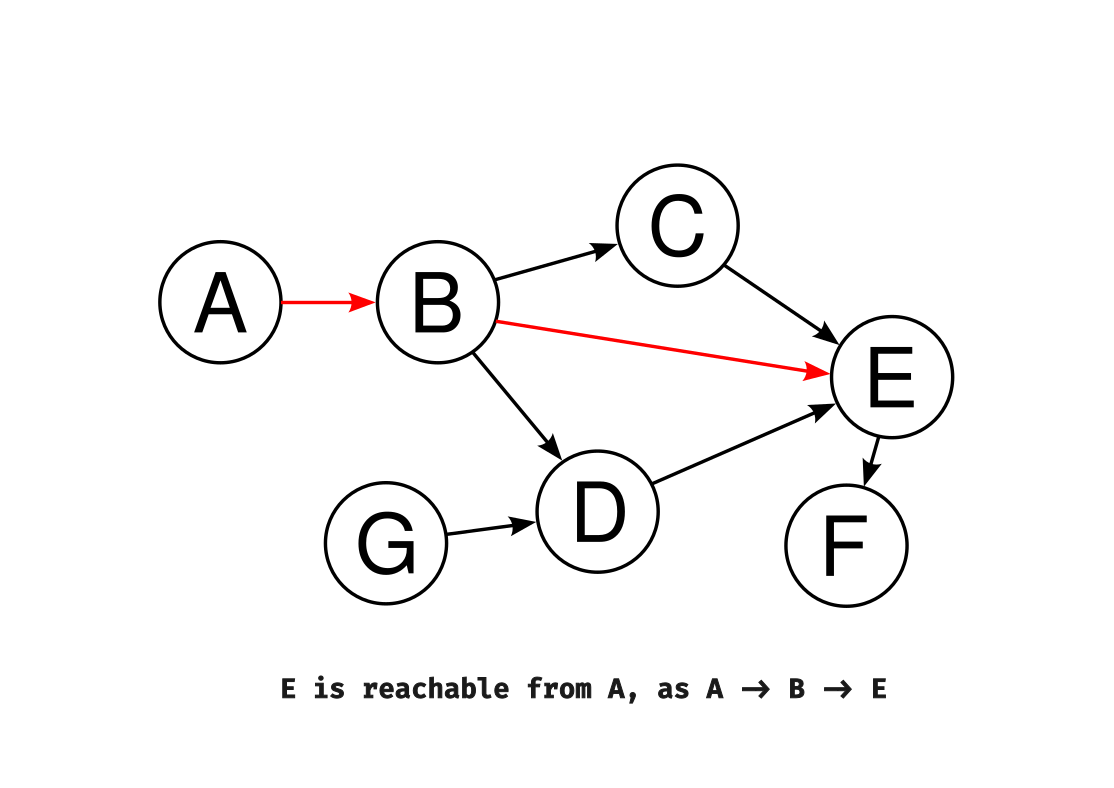
The algorithm that Go’s garbage collector uses is the mark and sweep algorithm. The mark and sweep algorithm is a two-phase garbage collection method that first marks all live objects in memory and then sweeps through the memory to deallocate unreferenced objects. In mark-and-sweep, the collector operates in two phases:
- Tracing (mark) phase: The collector traverses through the object graph by starting from the roots, and then marks each object it finds during its traversal.
- Sweeping phase: Finds unmarked objects, and determines them as garbage indirectly (mark-and-sweep doesn’t directly detect garbage, but assumes that unmarked objects are garbage.)
Go’s GC uses the concept of tri-color abstraction to efficiently track and identify live objects for garbage collection without stopping program execution for significant periods of time. (this is achieved by marking objects during mutation)
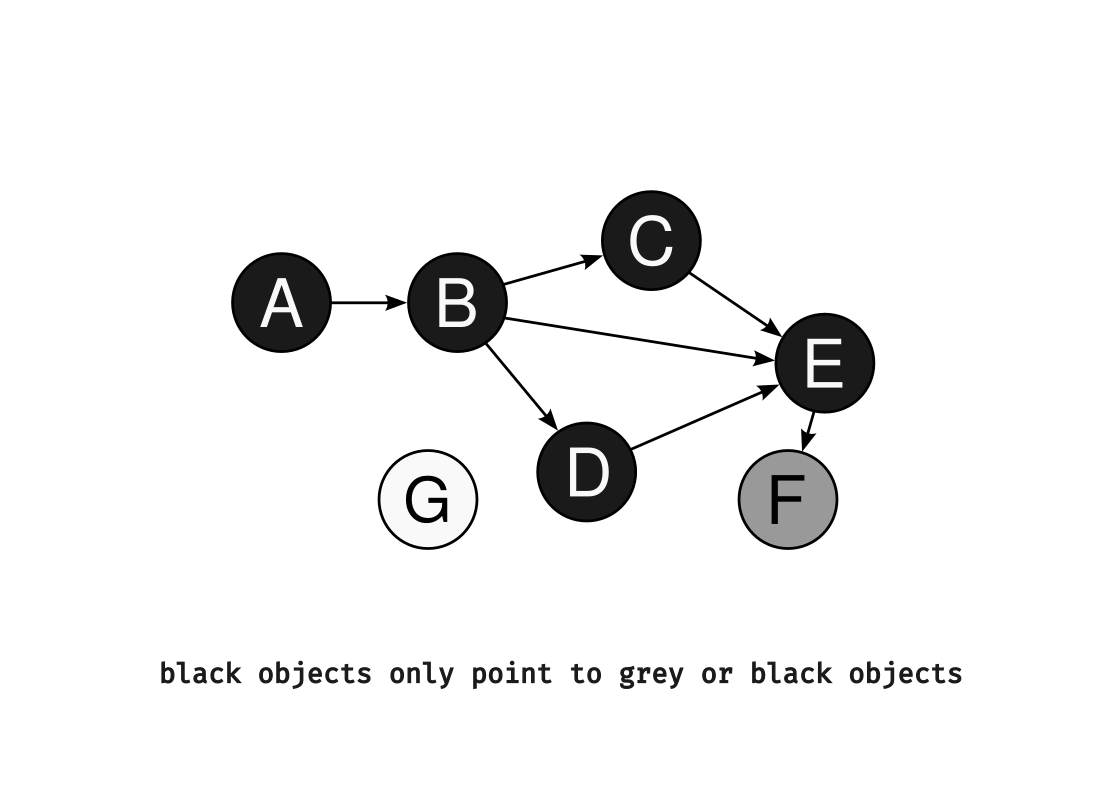
Under the tri-color abstraction, the object graph is partitioned into three colors (black, white, and grey). Initially, every node is white and the root is grey (as it is the first node that is encountered).
When an object is encountered by the collector, it is marked as grey, and when the object is scanned and its descendants are identified it is marked as black. Gray objects are those that are potentially reachable and need further examination, while black objects are confirmed as live and in use. Objects that remain white after this process can be safely deallocated.
Mark-and-sweep also focuses on preserving an invariant to guarantee correctness: at the end of each iteration of the marking loop, there are no references from black to white objects. White objects must be only reachable from a grey object.
What would happen if the invariant is to be broken? Let’s consider a black object pointing to a white object after the mark phase. As the algorithm doesn’t process black objects further, the white object will be reclaimed by the collector during the sweep phase, leading to the presence of dangling pointers.
Phew! Hope I didn’t bore you out this wall of text, but this would help understand the content below in a better way.
Exploring the runtime package and more
Everything we’re looking at right now has some overlap with the runtime. I knew that Go provides a runtime package, but I wasn’t sure if it exported any information related to the Go GC.
After some exploration, the closest related thing that I could find in the runtime package was runtime.MemStats. But MemStats exports numerical data; my goal isn’t to build a live chart of memory statistics, a lot of great tools do it already. I needed more information, numerical data isn’t going to help in any way.
Thankfully during my search, I came across Ardan Labs’ article on GC semantics, where a section on GC traces piqued my interest. GC traces seemed promising as they could be toggled using a flag and had a low entry barrier. However, the trace itself doesn’t have sufficient information on actual objects and I don’t blame it; traces aren’t meant to capture that information anyway.
I had to look for other solutions.
Forking Go
Yep, you read it right. I was tempted, really tempted. Let me explain this journey of forking Go.
So, nothing from the official Go standard library had been of help so far.
If I were to get the most information, the only place to look into would be the actual Go source code. runtime/mgc.go is the main GC algorithm, and is the expected place where I should be making tweaks to export data related to the mark-and-sweep process. (or maybe in runtime/mgcmark.go?)
But on further exploration and lots of code reading, I just couldn’t find a way to cleanly export this data. Every patch I tried to add resulted in more tweaks being made to different parts of the runtime. 2
The major challenge/disadvantage of using this approach was that I needed to maintain a forked version of Go. This also made the exploration more divergent than my intended goal - the idea was to make it run on the official Go releases, not forked versions.
Finally, I decided to stop making progress on this idea.
Heap dumps
At this point, I was lost. I did some more research and found a Go proposal which was interesting and close to my experiment’s goals.
After reading the title, I thought - “wow. why didn’t I ever think of using heap dumps?”
Heap dumps are snapshots of the program’s memory at a specific point in time.
The proposal talks about the various ways to obtain a heap dump: by using debug.WriteHeapDump, using standard core dumps, etc.
Since I wanted to stick closer to the Go runtime, I decided to go ahead with the heap dumps generated by Go as the source for obtaining more information.
I went straight to the playground and generated a heap dump in a few seconds. But I still had to parse it, and oh boy, I didn’t know that a working heap dump parser for Go 1.18 (the version I was working on at that time (Oct 2022)) didn’t exist.
Keith Randall’s heapdump14 was the standard heap dump parser for Go, but it wasn’t maintained for newer versions. Keeping up with the runtime is a challenging task.
Keith also mentioned that the GC has been exporting less information related to types in the recent versions. (I need you to keep this in mind for the sections below)
I looked up more parsers, but each parser had a few bugs that prevented me from getting a complete overview of the heap dump. 3
Understanding the heap dump format
Now, I had to build a simple heap dump parser on my own. To start working on the implementation, I needed to understand the heap dump format.
The Go wiki nicely documents this. A Go heap dump is essentially a sequence of records, where each record starts with a 64-bit unsigned integer describing the type of the record.
There are 17 record types:
- 0 = EOF
- 1 = object
- 2 = otherroot
- 3 = type
- 4 = goroutine
- 5 = stack frame
- 6 = dump params
- 7 = registered finalizer
- 8 = itab
- 9 = OS thread
- 10 = mem stats
- 11 = queued finalizer
- 12 = data segment
- 13 = bss segment
- 14 = defer record
- 15 = panic record
- 16 = alloc/free profile record
- 17 = alloc stack trace sample
To know more about how Go writes these heap dumps, I’d recommend checking the bonus section at the end of this post.
Parse, parse, parse
After understanding the heap dump format, I started working on building the parser. The basic approach for parsing it was pretty simple: identify the record type using the 64-bit unsigned integer, use a reader for that record type, and return the read contents.
The actual implementation looks something like this:
// parse.go

func ParseDump(rd *bufio.Reader) ([]RecordData, error) {
    err := record.ReadHeader(rd)
    if err != nil {
        return nil, err
    }

    ....

    for {
        r, err := record.ReadRecord(rd)
        if err != nil {
            return nil, err
        }

        ....
ReadRecord is the place where the type of record is identified and a suitable reader is initialized:
// record.go

func ReadRecord(r *bufio.Reader) (Record, error) {
    // Read record type
    recordType, err := binary.ReadUvarint(r)
    if err != nil {
        return nil, err
    }

    var record Record

    switch RecordType(recordType) {
    case EOF:
        record = &EOFRecord{}
    case Object:
        record = &ObjectRecord{}
    case OtherRoot:
        record = &OtherRootRecord{}
    case TypeDescriptor:
        record = &TypeDescriptorRecord{}
    case Goroutine:
        record = &GoroutineRecord{}
    case StackFrame:
        record = &StackFrameRecord{}
    case DumpParams:
        record = &DumpParamsRecord{}
    case RegisteredFinalizer:
        record = &RegisteredFinalizerRecord{}
    case ITab:
        record = &ITabRecord{}
    case OSThread:
        record = &OSThreadRecord{}
    case MemStats:
        record = &MemStatsRecord{}
    case QueuedFinalizer:
        record = &QueuedFinalizerRecord{}
    case DataSegment:
        record = &DataSegmentRecord{}
    case BSSSegment:
        record = &BSSSegmentRecord{}
    case DeferRecord:
        record = &DeferRecordRecord{}
    case PanicRecord:
        record = &PanicRecordRecord{}
    case AllocFreeProfile:
        record = &AllocFreeProfileRecord{}
    case AllocStackTraceSample:
        record = &AllocStackTraceSampleRecord{}
    default:
        return nil, fmt.Errorf("unexpected record type: %v", recordType)
    }

    // Read record. Each record implements the Record interface.
    err = record.Read(r)
    if err != nil {
        return nil, err
    }

    return record, nil
}
For example, if the record type is itab, then the reader’s implementation will look like this:
// itab.go

// uvarint: Itab address
// uvarint: address of type descriptor for contained type
type ITabRecord struct {
    Address            uint64
    TypeDescriptorAddr uint64
}

func (r *ITabRecord) GetAddress() uint64 {
    return r.Address
}

func (r *ITabRecord) Read(rd *bufio.Reader) error {
    var err error

    r.Address, err = binary.ReadUvarint(rd)
    if err != nil {
        return err
    }

    r.TypeDescriptorAddr, err = binary.ReadUvarint(rd)
    if err != nil {
        return err
    }

    return nil
}
By using this approach, I can get a textual representation of the entire heap:
OS thread at address 0x54b300 (Go internal ID = 0, OS ID = 53413)
Data segment at address 0x546660 (content size = 16784, pointers = 1184)
BSS segment at address 0x54a800 (content size = 196376, pointers = 10185)
Registered finalizer at address 0xc000078060, FuncVal ptr address = 0x4b7078, type = 4832448, object type = 4832448
Registered finalizer at address 0xc0000a8000, FuncVal ptr address = 0x4b7078, type = 4832448, object type = 4832448
Registered finalizer at address 0xc0000a8060, FuncVal ptr address = 0x4b7078, type = 4832448, object type = 4832448
Registered finalizer at address 0xc0000a80c0, FuncVal ptr address = 0x4b7078, type = 4832448, object type = 4832448
While I reached near completion on this parser, I got to know that a similar parser existed in the heapspurs tool, which I wasn’t aware of. (Sigh. Why didn’t I come across it earlier?)
heapspurs tries to do a lot more, but the core idea of parsing remains the same - identify record types using the 64-bit unsigned integer and read the contents based on the record type.
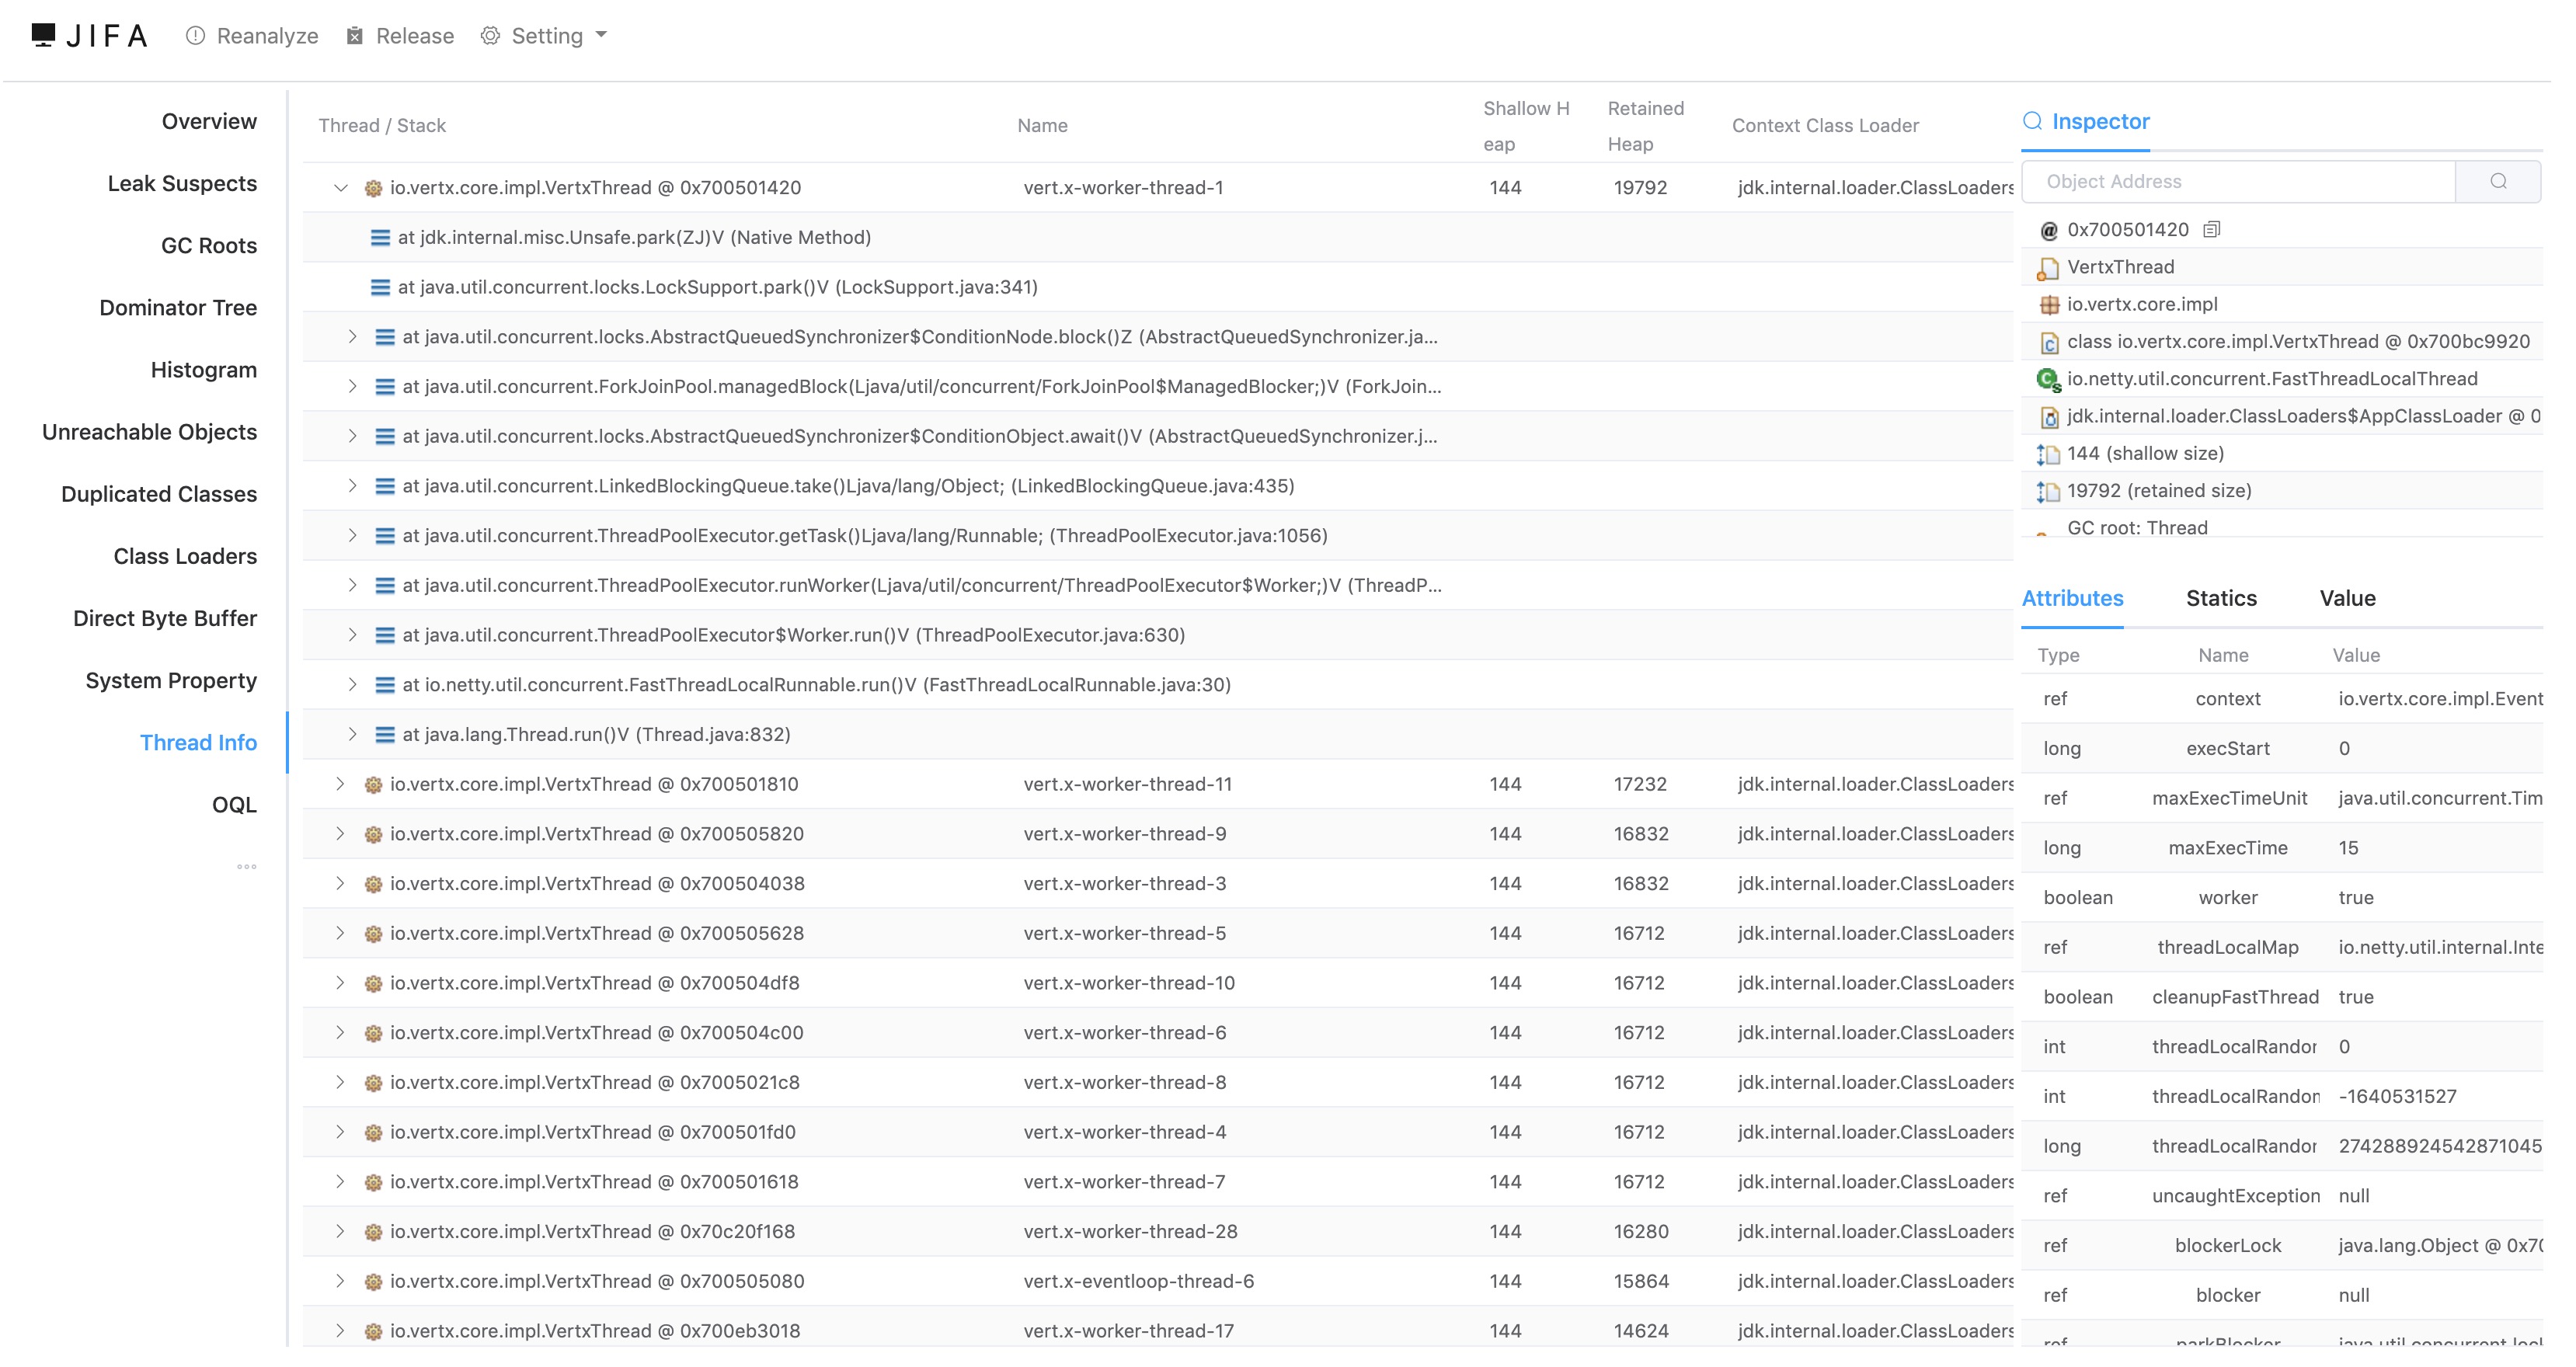
However, I wanted the result to be somewhat similar to Eclipse Jifa’s heap dump view. So, I separated the parsing logic into a different project (heaputil) (in case anyone else wants to use it) and decided to build a separate project (heapview) for the visualizer.
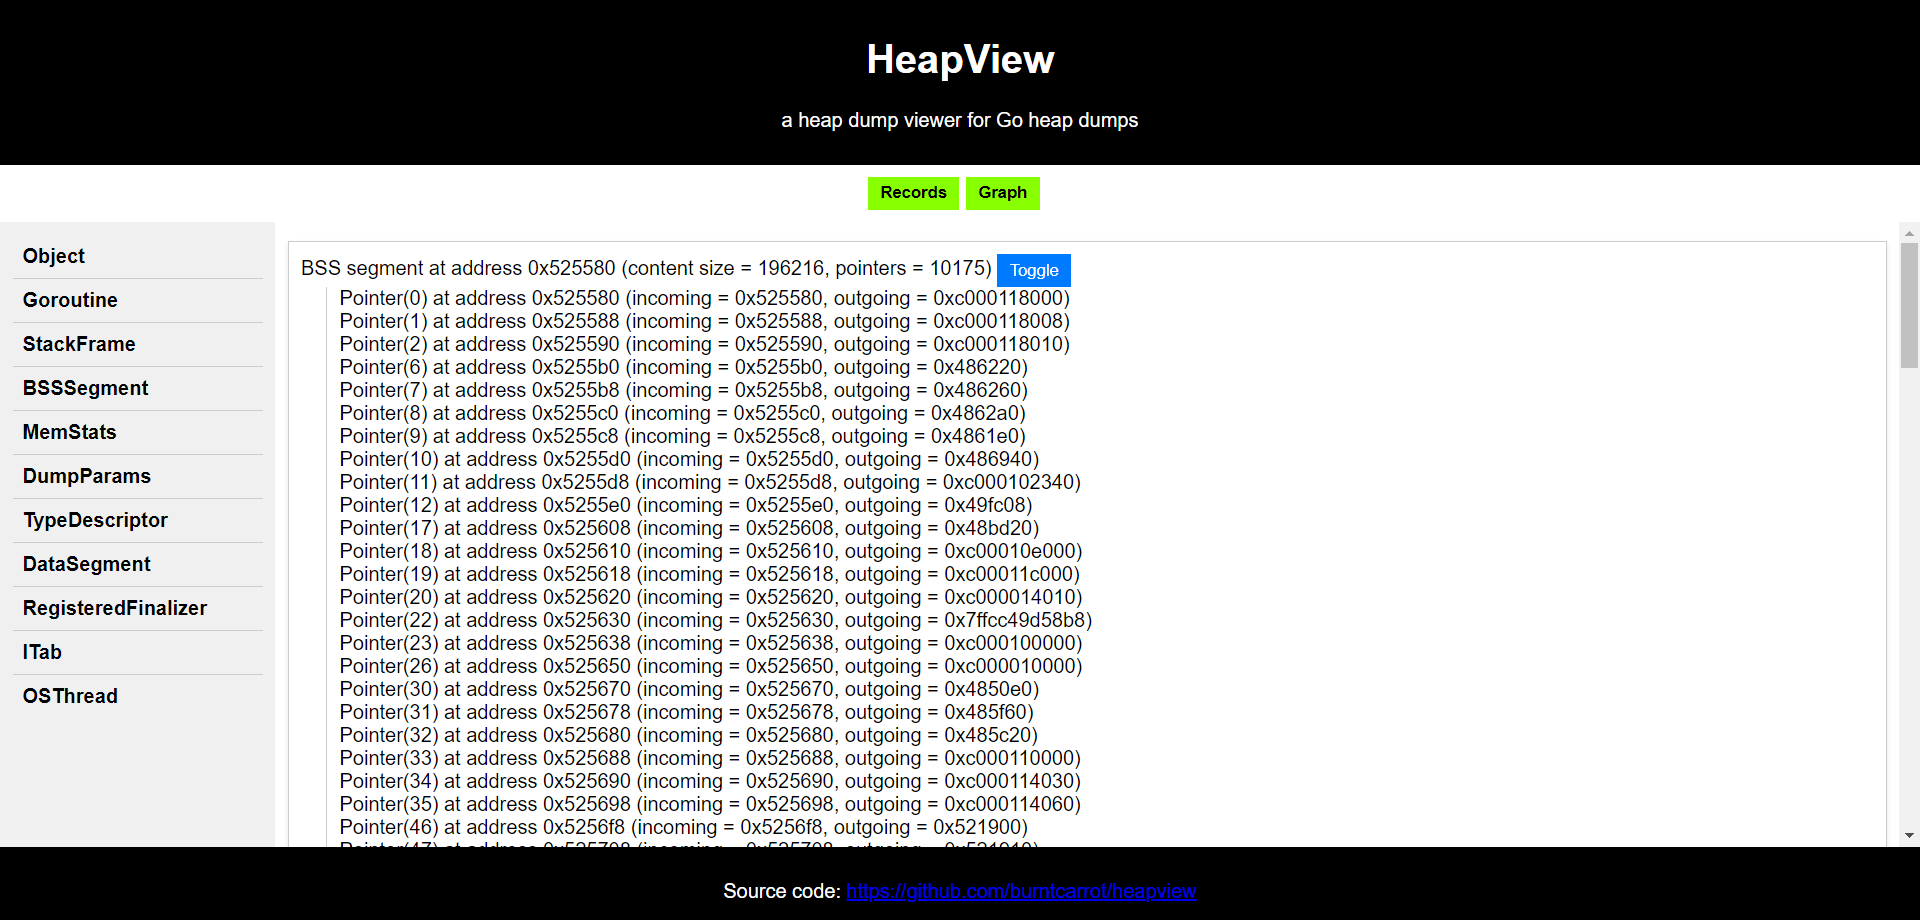
I built the records view using HTML templates:
<!-- Records view -->
    <div id="recordsView">
        {{range .Records}}
            <div class="row {{.RecordType}}">
                {{.Repr}}
                {{if .HasPointers}}
                    <button onclick="toggleRow('{{.RowID}}')">Toggle</button>
                    <div id="{{.RowID}}" class="pointer-info" style="display: none;">
                        {{range .Pointers}}
                            <p>Pointer({{.Index}}) at address 0x{{.Address}} (incoming = 0x{{.Incoming}}, outgoing = 0x{{.Outgoing}})</p>
                        {{end}}
                    </div>
                {{end}}
            </div>
        {{end}}
    </div>
....

    data := templateData{
        RecordTypes:     GetUniqueRecordTypes(records),
        Records:         records,
        GraphVizContent: graphContent,
    }

    var htmlBuilder strings.Builder
    err = tmpl.Execute(&htmlBuilder, data)
    if err != nil {
        return "", err
    }

....
Which results in a fairly nice view of individual records:
Building object graphs
The main part of the visualization is the object graph. An object graph is essentially a visual or conceptual map that shows how different objects in the heap are connected to each other through references or pointers.
Even before building the object graph, I had to decide on what record types are going to be a part of it. A small heap dump can have a lot of records, and representing everything in the object graph is not going to work out. (Note: I’m not talking about other types like Gs and Ms 4, but other “objects” like data segments and BSS segments.)
For the initial implementation, I wanted to keep the scope small - so, the focus was only on objects. No data or BSS segments.
What would a barebones implementation for this look like? After some head-scratching, I decided to do some additional things while parsing each record:
- if the record isn’t of type
Object, just ignore. (to keep the graph small) - create a node with a unique ID, where the label would have details (name, address, etc.)
- the name and address is extracted from the record’s representation (
Repr) (yup, a tiny hack) - create edges for outgoing pointers
    for {
        r, err := record.ReadRecord(rd)
        if err != nil {
            return dotContent.String(), err
        }

        _, isEOF := r.(*record.EOFRecord)
        if isEOF {
            break
        }

        dp, isDumpParams := r.(*record.DumpParamsRecord)
        if isDumpParams {
            dumpParams = dp
        }

        // Filter out objects. If the record isn't of the type Object, ignore.
        _, isObj := r.(*record.ObjectRecord)
        if !isObj {
            continue
        }

        // Create a DOT node for each record
        nodeName := fmt.Sprintf("Node%d", counter)
        counter++
        name, address := ParseNameAndAddress(r.Repr())
        nodeLabel := fmt.Sprintf("[%s] %s", name, address)

        // Write DOT node entry within the "heap" cluster
        s := fmt.Sprintf("    %s [label=\"%s\"];\n", nodeName, nodeLabel)
        dotContent.WriteString(s)

        // Check if the record has pointers
        p, isParent := r.(record.ParentGuard)
        if isParent {
            _, outgoing := record.ParsePointers(p, dumpParams)
            for i := 0; i < len(outgoing); i++ {
                if outgoing[i] != 0 {
                    childNodeName := fmt.Sprintf("Pointer0x%x", outgoing[i])

                    // Create an edge from the current record to the child record
                    s := fmt.Sprintf("    %s -> %s;\n", nodeName, childNodeName)
                    dotContent.WriteString(s)
                }
            }
        }
    }
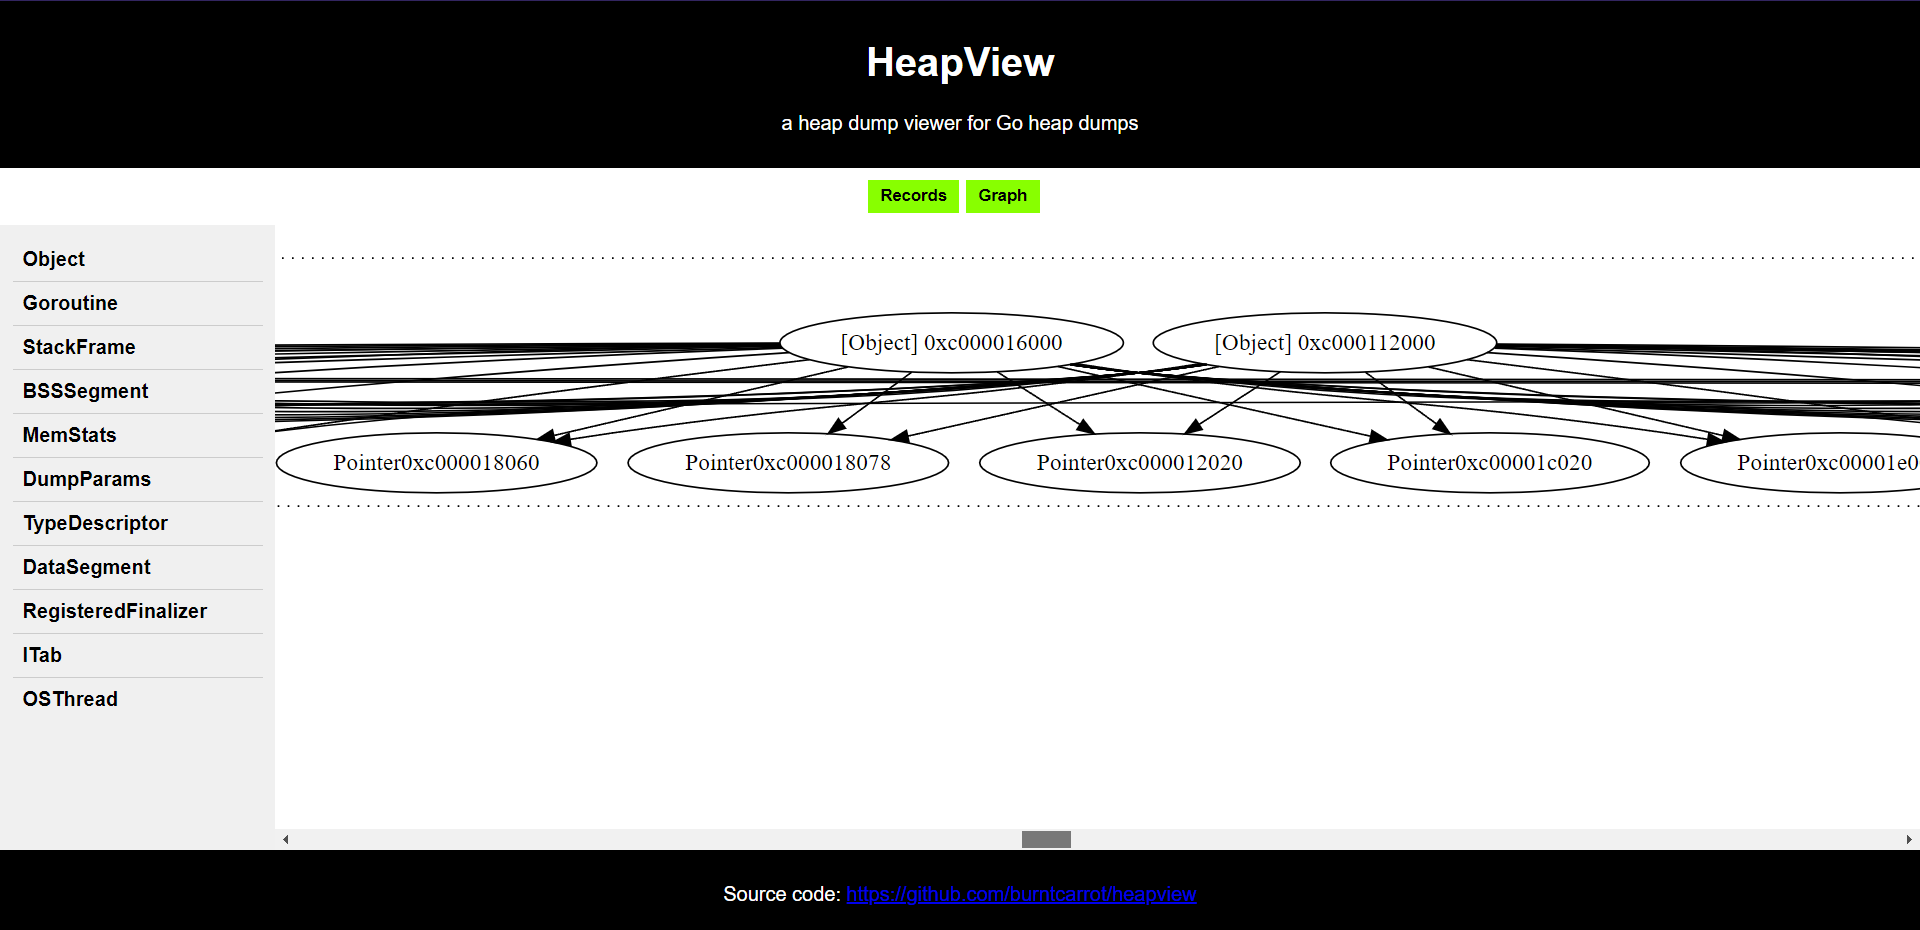
Now, to render this to a HTML view, I used viz.js (ignore the terrible JS code, I’m not good at it):
<!-- Graph view (initially hidden) -->
    <div id="graphView" style="display: none;">
        <div id="graphContainer">
            <!-- The GraphViz graph will be rendered here using viz.js -->
        </div>
    </div>
</div>
<!-- .... -->
<script src="https://cdnjs.cloudflare.com/ajax/libs/viz.js/2.1.2/viz.js"></script>
<!-- .... -->
<script>
    // ....

    // Function to render the GraphViz graph
    function renderGraph(graphVizContent) {
        var graphContainer = document.getElementById("graphContainer");

        // Create a new Viz instance with the graph content and render it
        var viz = new Viz();
        viz.renderSVGElement(graphVizContent)
            .then(function(element) {
                // Append the SVG element to the container
                graphContainer.innerHTML = "";
                graphContainer.appendChild(element);
            })
            .catch(function(error) {
                console.error(error);
            });
    }
</script>
This finally came into life like this:
Source code is available here!
Coloring nodes
With the object graph in place, all that was required to bring this experiment to an almost completed stage was to figure out the core “algorithm” to color individual nodes with any of these three colors (black, grey, white) to emulate the tri-color mark-sweep algorithm.
A rough sketch looked like this:
- take two “snapshots” (heap dumps) at different times
- compare the heap dumps and identify “dangling” objects
- a “dangling” object could be assumed to have no references; which means it is waiting to get GC’d (garbage collected)
- we can color these objects as white?
- objects with existing pointers can be colored black, and their descendants can be colored grey.
This looked good enough, but I had to at least figure out the color coding “algorithm” on a single object graph; irrespective of temporal aspects. I could build on top on this foundational algorithm, and can add context in terms of time - seemed reasonable.
The foundational algorithm would be similar:
- take a heap dump
- construct the object graph
- identify objects with pointers and color them black, and their descendants grey.
- color objects without references as white
This assumes that objects which are “standalone” (without any references) are garbage and are waiting to be collected by the GC. The descendants of the black object are immediately colored grey to preserve the invariant which I mentioned above. (black objects cannot point to white objects)
Writing code for this part was a bit harder than I thought. I went ahead with parsing the original graph using regular expressions to distinguish between nodes and edges. If a node is encountered, we color it grey, and if has children nodes, we color it black. Here’s the hacky code I wrote for achieving this:
// NodeColor represents the color of a node in the graph.
type NodeColor int

const (
    White NodeColor = iota
    Grey
    Black
)

func ColorGraph(inputPath, outputPath string) error {
    file, err := os.Open(inputPath)
    if err != nil {
        return err
    }
    defer file.Close()

    nodeColors := make(map[string]NodeColor)

    // Parse the GraphViz file and determine node colors.
    err = determineNodeColors(file, nodeColors)
    if err != nil {
        return err
    }

    // Modify the graph to add node colors.
    err = applyColors(inputPath, outputPath, nodeColors)
    if err != nil {
        return err
    }

    return nil
}

func determineNodeColors(dotFile io.Reader, nodeColors map[string]NodeColor) error {
    scanner := bufio.NewScanner(dotFile)

    // Regular expression pattern to match node lines.
    nodePattern := regexp.MustCompile(`^\s+(\w+)\s+\[.*\]`)

    // Regular expression pattern to match edge lines.
    edgePattern := regexp.MustCompile(`^\s+(\w+)\s+->\s+(\w+)`)

    for scanner.Scan() {
        line := scanner.Text()
        if matches := nodePattern.FindStringSubmatch(line); matches != nil {
            // This is a node line.
            nodeName := matches[1]

            // Processed object, color it as grey.
            nodeColors[nodeName] = Grey
        } else if matches := edgePattern.FindStringSubmatch(line); matches != nil {
            // This is an edge line.
            sourceNode := matches[1]

            // Mark the source node as black.
            nodeColors[sourceNode] = Black
        }
    }

    return nil
}

func applyColors(inputPath, outputPath string, nodeColors map[string]NodeColor) error {
    content, err := os.ReadFile(inputPath)
    if err != nil {
        return err
    }

    // Create a regular expression pattern to match node lines.
    nodePattern := regexp.MustCompile(`^\s+(\w+)\s+\[.*\]`)

    lines := strings.Split(string(content), "\n")

    var modifiedContent strings.Builder

    for _, line := range lines {
        if matches := nodePattern.FindStringSubmatch(line); matches != nil {
            nodeName := matches[1]
            color, exists := nodeColors[nodeName]
            if exists {
                line = line[:len(line)-2]

                fontColor := "black"
                if color == Black {
                    fontColor = "white"
                }

                // Modify the line to include the fillcolor and fontcolor attributes with the determined color.
                line = fmt.Sprintf("%s fillcolor=%s, fontcolor=%s, style=filled];", line, getColorName(color), fontColor)
            }
        }
        modifiedContent.WriteString(line)
        modifiedContent.WriteString("\n")
    }

    // Write the modified GraphViz content to the output GraphViz file.
    err = os.WriteFile(outputPath, []byte(modifiedContent.String()), 0644)
    if err != nil {
        return err
    }

    return nil
}
This resulted in this object graph (trimmed for easier visualization):
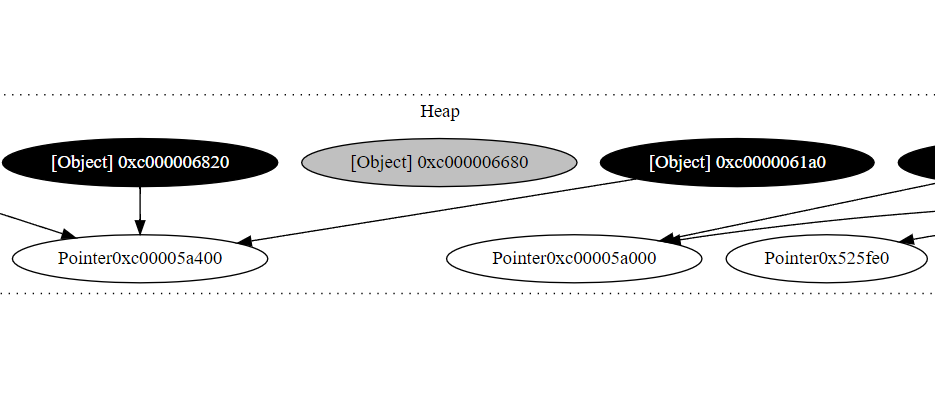
What a relief. I finally had managed to figure out coloring individual nodes; and this brought me to closer to my end goal.
What’s next?
I’d like to continue working on it, but since I’ve been affected by layoffs, I’ll need to prioritize interview preparation for now.
I feel that more type information can be extracted from core dumps using viewcore. viewcore is a tool for exploring the state of a Go process that has dumped core. I had considered using viewcore, and even made a forum post for understanding more about it:
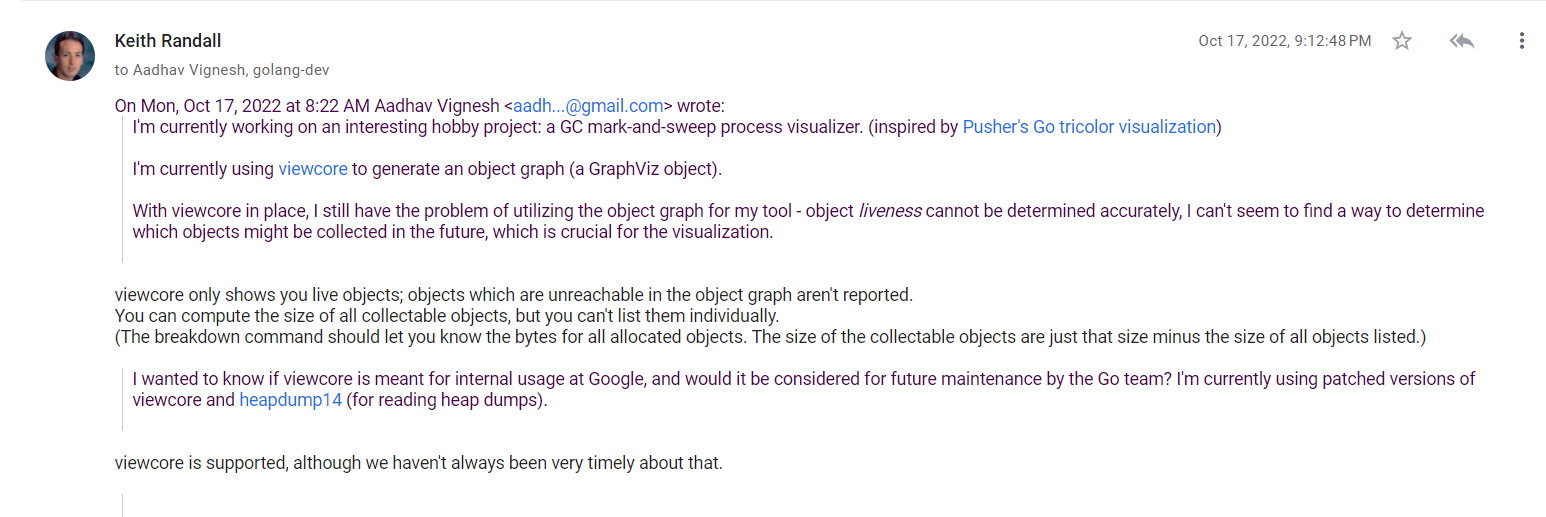
But since I was focusing on extracting information from heap dumps written by debug.WriteHeapDump, I couldn’t get much time to explore standard core dumps. Using core dumps might be a better way do it, as with more type information, the construction of object graphs becomes easier; and you get more detailed information as opposed to plain objects with addresses.
The animation part is easy - either iterate over a set of GraphViz graphs and generate a GIF, or parse each graph, check if the object references have changed or not and generate even smoother animations.
If you’d like to contribute or have better ideas, please create an issue on this repository. I’ll be happy to assist with any improvements!
I’ve open sourced the heap dump parser as heaputil, and the heap dump visualizer as heapview.
Are you hiring?
I’m looking for new roles in backend/systems/infrastructure engineering (open to general roles as well!); if you’re hiring, please reach out to me via work <at> aadhav.me, Twitter DMs or LinkedIn.
I have ~7 months of full-time experience, and I primarily work with Go/Python (I tinker around with Rust/Elixir occasionally).
Location preference: EU/APAC (remote), India (in-office). Also interested in globally distributed teams.
(sorry for the interruption, back to the bonus section!)
BONUS: How does Go write heap dumps?
I’ll try to explain how Go writes heap dumps. (I explored this while I was taking a look at the GC internals)
//go:linkname runtime_debug_WriteHeapDump runtime/debug.WriteHeapDump
func runtime_debug_WriteHeapDump(fd uintptr) {
    stopTheWorld(stwWriteHeapDump)

    // Keep m on this G's stack instead of the system stack.
    // Both readmemstats_m and writeheapdump_m have pretty large
    // peak stack depths and we risk blowing the system stack.
    // This is safe because the world is stopped, so we don't
    // need to worry about anyone shrinking and therefore moving
    // our stack.
    var m MemStats
    systemstack(func() {
        // Call readmemstats_m here instead of deeper in
        // writeheapdump_m because we might blow the system stack
        // otherwise.
        readmemstats_m(&m)
        writeheapdump_m(fd, &m)
    })

    startTheWorld()
}
Notice the first line, the go:linkname directive is used to link the internal implementation to the externally-available runtime/debug.WriteHeapDump as the format for the go:linkname is // go:linkname localname importpath.name. More explanation:
The //go:linkname directive instructs the compiler to use “importpath.name” as the object file symbol name for the variable or function declared as “localname” in the source code. Because this directive can subvert the type system and package modularity, it is only enabled in files that have imported “unsafe”.
writeheapdump_m has the logic for writing the heap dump:
func writeheapdump_m(fd uintptr, m *MemStats) {
    assertWorldStopped()

    gp := getg()
    casGToWaiting(gp.m.curg, _Grunning, waitReasonDumpingHeap)

    // Set dump file.
    dumpfd = fd

    // Call dump routine.
    mdump(m)

    // Reset dump file.
    dumpfd = 0
    if tmpbuf != nil {
        sysFree(unsafe.Pointer(&tmpbuf[0]), uintptr(len(tmpbuf)), &memstats.other_sys)
        tmpbuf = nil
    }

    casgstatus(gp.m.curg, _Gwaiting, _Grunning)
}
It calls the assertWorldStopped function to ensure that the Go scheduler (the “world”) is in a stopped state. This is typically done to prevent concurrent execution and ensure safety while performing certain operations.
getg returns the pointer to the current G, and it sets its state to a waiting stage with a wait reason. The file descriptor is passed from the top level debug.WriteHeapDump is set to dumpfd (a global file descriptor). The main dump routine mdump is called, and G’s status is set to running.
Now, what does mdump do?
var dumphdr = []byte("go1.7 heap dump\n")

func mdump(m *MemStats) {
    assertWorldStopped()

    // make sure we're done sweeping
    for _, s := range mheap_.allspans {
        if s.state.get() == mSpanInUse {
            s.ensureSwept()
        }
    }
    memclrNoHeapPointers(unsafe.Pointer(&typecache), unsafe.Sizeof(typecache))
    dwrite(unsafe.Pointer(&dumphdr[0]), uintptr(len(dumphdr)))
    dumpparams()
    dumpitabs()
    dumpobjs()
    dumpgs()
    dumpms()
    dumproots()
    dumpmemstats(m)
    dumpmemprof()
    dumpint(tagEOF)
    flush()
}
At first, mdump checks if the heap’s spans (which are in use) are swept. Once ensured, it writes the header go1.7 heap dump and calls other functions for dumping information. Let’s look at dumpparams first:
func dumpparams() {
    dumpint(tagParams)
    x := uintptr(1)
    if *(*byte)(unsafe.Pointer(&x)) == 1 {
        dumpbool(false) // little-endian ptrs
    } else {
        dumpbool(true) // big-endian ptrs
    }
    dumpint(goarch.PtrSize)
    var arenaStart, arenaEnd uintptr
    for i1 := range mheap_.arenas {
        if mheap_.arenas[i1] == nil {
            continue
        }
        for i, ha := range mheap_.arenas[i1] {
            if ha == nil {
                continue
            }
            base := arenaBase(arenaIdx(i1)<<arenaL1Shift | arenaIdx(i))
            if arenaStart == 0 || base < arenaStart {
                arenaStart = base
            }
            if base+heapArenaBytes > arenaEnd {
                arenaEnd = base + heapArenaBytes
            }
        }
    }
    dumpint(uint64(arenaStart))
    dumpint(uint64(arenaEnd))
    dumpstr(goarch.GOARCH)
    dumpstr(buildVersion)
    dumpint(uint64(ncpu))
}
At first, an integer associated with the record type is dumped, and then the endianness of the pointers is calculated. The pointer size in bytes is dumped. The heap arena map is iterated, and the heap’s start and end addresses are calculated. (I don’t understand the logic behind the bitwise operations; if you do please let me know!)
Once the addresses are computed, they are dumped. Other info like the Go architecture, build version and the ncpu are also dumped.
Next up are itabs. But what are they? Let me explain:
Each interface type in Go is associated with an itab, a runtime data structure that stores information about the concrete type implementing the interface and pointers to its methods.
When a method is invoked on an interface value, the Go runtime utilizes the itab to identify the concrete type and dispatch the call to the appropriate method implementation, ensuring that the correct behavior is executed. Consider it as an equivalent to a phonebook for your interfaces. 5
A callback for dumping itab-related information is specified here:
func itab_callback(tab *itab) {
    t := tab._type
    dumptype(t)
    dumpint(tagItab)
    dumpint(uint64(uintptr(unsafe.Pointer(tab))))
    dumpint(uint64(uintptr(unsafe.Pointer(t))))
}

func dumpitabs() {
    iterate_itabs(itab_callback)
}
which is called by iterate_itabs, which gets the itab and iterates over it. On each iteration, the callback function is executed, which keeps dumping data. Data dumped for each itab record includes the ITab (tab) address and the address of type descriptor for contained type (t).
// iface.go

func iterate_itabs(fn func(*itab)) {
    // Note: only runs during stop the world or with itabLock held,
    // so no other locks/atomics needed.
    t := itabTable
    for i := uintptr(0); i < t.size; i++ {
        m := *(**itab)(add(unsafe.Pointer(&t.entries), i*goarch.PtrSize))
        if m != nil {
            fn(m)
        }
    }
}
dumpobjs dumps information related to objects:
func dumpobjs() {
    // To protect mheap_.allspans.
    assertWorldStopped()

    for _, s := range mheap_.allspans {
        if s.state.get() != mSpanInUse {
            continue
        }
        p := s.base()
        size := s.elemsize
        n := (s.npages << _PageShift) / size
        if n > uintptr(len(freemark)) {
            throw("freemark array doesn't have enough entries")
        }

        for freeIndex := uintptr(0); freeIndex < s.nelems; freeIndex++ {
            if s.isFree(freeIndex) {
                freemark[freeIndex] = true
            }
        }

        for j := uintptr(0); j < n; j, p = j+1, p+size {
            if freemark[j] {
                freemark[j] = false
                continue
            }
            dumpobj(unsafe.Pointer(p), size, makeheapobjbv(p, size))
        }
    }
}
Go iterates over all spans, and does the following:
- It calculates the base address
pof the span. - It determines the size of each element in the span (size) and the number of elements (n) that can fit in the span.
- It checks if the number of elements
nexceeds the length of the freemark array and throws an error if there are not enough entries in freemark. - It iterates over each element in the span, checking whether it is marked as free by inspecting the corresponding freemark entry. If an element is marked as free, it updates the freemark entry to true.
If an element is not marked as free, it calls the
dumpobjfunction to dump information about that object.
func dumpobj(obj unsafe.Pointer, size uintptr, bv bitvector) {
    dumpint(tagObject)
    dumpint(uint64(uintptr(obj)))
    dumpmemrange(obj, size)
    dumpfields(bv)
}
dumpgs dumps goroutine information:
func dumpgs() {
    assertWorldStopped()

    // goroutines & stacks
    forEachG(func(gp *g) {
        status := readgstatus(gp) // The world is stopped so gp will not be in a scan state.
        switch status {
        default:
            print("runtime: unexpected G.status ", hex(status), "\n")
            throw("dumpgs in STW - bad status")
        case _Gdead:
            // ok
        case _Grunnable,
            _Gsyscall,
            _Gwaiting:
            dumpgoroutine(gp)
        }
    })
}
Here, it iterates over each G, gets its status, and calls dumpgoroutine when the G is in a runnable, syscall or a waiting state.
The dumpgoroutine function is pretty heavy, it does the following:
- dumps a lot of information about the goroutine (including the stack pointer, goroutine ID, etc.) 6
- uses an unwinder to unwind/iterate the physical stack frames of a Go stack
- use the unwinded stack frame, and dump its information 7
- dump the panic and defer records held by the G
func dumpgoroutine(gp *g) {
    var sp, pc, lr uintptr
    if gp.syscallsp != 0 {
        sp = gp.syscallsp
        pc = gp.syscallpc
        lr = 0
    } else {
        sp = gp.sched.sp
        pc = gp.sched.pc
        lr = gp.sched.lr
    }

    dumpint(tagGoroutine)
    dumpint(uint64(uintptr(unsafe.Pointer(gp))))
    dumpint(uint64(sp))
    dumpint(gp.goid)
    dumpint(uint64(gp.gopc))
    dumpint(uint64(readgstatus(gp)))
    dumpbool(isSystemGoroutine(gp, false))
    dumpbool(false) // isbackground
    dumpint(uint64(gp.waitsince))
    dumpstr(gp.waitreason.String())
    dumpint(uint64(uintptr(gp.sched.ctxt)))
    dumpint(uint64(uintptr(unsafe.Pointer(gp.m))))
    dumpint(uint64(uintptr(unsafe.Pointer(gp._defer))))
    dumpint(uint64(uintptr(unsafe.Pointer(gp._panic))))

    // dump stack
    var child childInfo
    child.args.n = -1
    child.arglen = 0
    child.sp = nil
    child.depth = 0
    var u unwinder
    for u.initAt(pc, sp, lr, gp, 0); u.valid(); u.next() {
        dumpframe(&u.frame, &child)
    }

    // dump defer & panic records
    for d := gp._defer; d != nil; d = d.link {
        dumpint(tagDefer)
        dumpint(uint64(uintptr(unsafe.Pointer(d))))
        dumpint(uint64(uintptr(unsafe.Pointer(gp))))
        dumpint(uint64(d.sp))
        dumpint(uint64(d.pc))
        fn := *(**funcval)(unsafe.Pointer(&d.fn))
        dumpint(uint64(uintptr(unsafe.Pointer(fn))))
        if d.fn == nil {
            // d.fn can be nil for open-coded defers
            dumpint(uint64(0))
        } else {
            dumpint(uint64(uintptr(unsafe.Pointer(fn.fn))))
        }
        dumpint(uint64(uintptr(unsafe.Pointer(d.link))))
    }
    for p := gp._panic; p != nil; p = p.link {
        dumpint(tagPanic)
        dumpint(uint64(uintptr(unsafe.Pointer(p))))
        dumpint(uint64(uintptr(unsafe.Pointer(gp))))
        eface := efaceOf(&p.arg)
        dumpint(uint64(uintptr(unsafe.Pointer(eface._type))))
        dumpint(uint64(uintptr(eface.data)))
        dumpint(0) // was p->defer, no longer recorded
        dumpint(uint64(uintptr(unsafe.Pointer(p.link))))
    }
}
dumproots does the following:
- dumps data and BSS segments through
dumpmemrange - checks the spans and iterates over
specials(a linked list of special records sorted by offset held in the span) - dumps information related to the registered finalizers
- and finally, the
finq_callbackis passed toiterate_finqwhich iterates over all queued finalizers and executes the callback to dump information
func dumproots() {
    // To protect mheap_.allspans.
    assertWorldStopped()

    // TODO(mwhudson): dump datamask etc from all objects
    // data segment
    dumpint(tagData)
    dumpint(uint64(firstmoduledata.data))
    dumpmemrange(unsafe.Pointer(firstmoduledata.data), firstmoduledata.edata-firstmoduledata.data)
    dumpfields(firstmoduledata.gcdatamask)

    // bss segment
    dumpint(tagBSS)
    dumpint(uint64(firstmoduledata.bss))
    dumpmemrange(unsafe.Pointer(firstmoduledata.bss), firstmoduledata.ebss-firstmoduledata.bss)
    dumpfields(firstmoduledata.gcbssmask)

    // mspan.types
    for _, s := range mheap_.allspans {
        if s.state.get() == mSpanInUse {
            // Finalizers
            for sp := s.specials; sp != nil; sp = sp.next {
                if sp.kind != _KindSpecialFinalizer {
                    continue
                }
                spf := (*specialfinalizer)(unsafe.Pointer(sp))
                p := unsafe.Pointer(s.base() + uintptr(spf.special.offset))
                dumpfinalizer(p, spf.fn, spf.fint, spf.ot)
            }
        }
    }

    // Finalizer queue
    iterate_finq(finq_callback)
}

func dumpfinalizer(obj unsafe.Pointer, fn *funcval, fint *_type, ot *ptrtype) {
    dumpint(tagFinalizer)
    dumpint(uint64(uintptr(obj)))
    dumpint(uint64(uintptr(unsafe.Pointer(fn))))
    dumpint(uint64(uintptr(unsafe.Pointer(fn.fn))))
    dumpint(uint64(uintptr(unsafe.Pointer(fint))))
    dumpint(uint64(uintptr(unsafe.Pointer(ot))))
}

func finq_callback(fn *funcval, obj unsafe.Pointer, nret uintptr, fint *_type, ot *ptrtype) {
    dumpint(tagQueuedFinalizer)
    dumpint(uint64(uintptr(obj)))
    dumpint(uint64(uintptr(unsafe.Pointer(fn))))
    dumpint(uint64(uintptr(unsafe.Pointer(fn.fn))))
    dumpint(uint64(uintptr(unsafe.Pointer(fint))))
    dumpint(uint64(uintptr(unsafe.Pointer(ot))))
}
Dumping Ms and mem stats is similar to what we have seen so far, so I won’t be explaining it.
func dumpms() {
    for mp := allm; mp != nil; mp = mp.alllink {
        dumpint(tagOSThread)
        dumpint(uint64(uintptr(unsafe.Pointer(mp))))
        dumpint(uint64(mp.id))
        dumpint(mp.procid)
    }
}

//go:systemstack
func dumpmemstats(m *MemStats) {
    assertWorldStopped()

    // These ints should be identical to the exported
    // MemStats structure and should be ordered the same
    // way too.
    dumpint(tagMemStats)
    dumpint(m.Alloc)
    dumpint(m.TotalAlloc)
    dumpint(m.Sys)
    dumpint(m.Lookups)
    dumpint(m.Mallocs)
    dumpint(m.Frees)
    dumpint(m.HeapAlloc)
    dumpint(m.HeapSys)
    dumpint(m.HeapIdle)
    dumpint(m.HeapInuse)
    dumpint(m.HeapReleased)
    dumpint(m.HeapObjects)
    dumpint(m.StackInuse)
    dumpint(m.StackSys)
    dumpint(m.MSpanInuse)
    dumpint(m.MSpanSys)
    dumpint(m.MCacheInuse)
    dumpint(m.MCacheSys)
    dumpint(m.BuckHashSys)
    dumpint(m.GCSys)
    dumpint(m.OtherSys)
    dumpint(m.NextGC)
    dumpint(m.LastGC)
    dumpint(m.PauseTotalNs)
    for i := 0; i < 256; i++ {
        dumpint(m.PauseNs[i])
    }
    dumpint(uint64(m.NumGC))
}
Conclusion
And that is it! I never knew that I’d be spending my time on this, but it has been a great experience!
Please let me know if you have any comments or want to know more about the experiment! You can reach out to me via contact <at> aadhav.me, Twitter DMs or LinkedIn.
- I had backups configured for my main drive, but not for WSL (Windows Subsystem for Linux), where I had my entire playground. Windows is currently my primary operating system, and I’ve been enjoying some gaming on Steam during my free time. ↩︎
- GC code has a lot of pointer logic which I don’t understand. Effectively patching to export information felt like a gargantuan task. ↩︎
- gohat was one alternative to heapdump14, but it didn’t work. I also tried multiple forks of heapdump14, and gohat but they didn’t work as well. Someone also built a GNU poke pickle for reading Go heap dumps, but I wasn’t able to install poke after multiple tries, so I left it alone. ↩︎
- A G is a goroutine, a M is an OS thread. The Go scheduler’s job is to match a G (code to execute), a M (where to execute), and a P (resources to execute it). ↩︎
- If you’d like to learn more, check out the go-internals chapter on interfaces. ↩︎
- https://github.com/golang/go/wiki/heapdump15-through-heapdump17#goroutine-g ↩︎
- https://cs.opensource.google/go/go/+/master:src/runtime/traceback.go;drc=2744155d369ca838be57d1eba90c3c6bfc4a3b30;bpv=0;bpt=1;l=94 ↩︎